











Be the first to access the Q3 2025 Guest Experience Benchmark Infographics. Sign up now to get the insights on the official release on October 16th.


Be the first to access the Q3 2025 Guest Experience Benchmark Infographics. Sign up now to get the insights on the official release on October 16th.


Why you shouldn’t miss these infographics
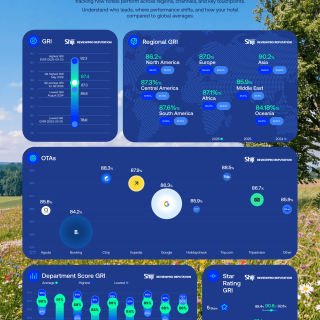
Every review tells a story. In the Q3 2025 Guest Experience Benchmark Infographics, we uncover the latest shifts in guest satisfaction and online reputation worldwide. From rising global review volume to regional contrasts, the data reveals how hospitality is evolving.
This quarter, highlights include faster response times, strong growth in Google reviews, and Asia leading performance with the highest GRI worldwide. Dive in to see how your region compares and where opportunities for improvement lie.
Some more key results

Why you shouldn’t miss these infographics
Every review tells a story. In the Q3 2025 Guest Experience Benchmark Report, we uncover the latest shifts in guest satisfaction and online reputation worldwide. From rising global review volume to regional contrasts, the data reveals how hospitality is evolving.
This quarter, highlights include faster response times, strong growth in Google reviews, and Asia leading performance with the highest GRI worldwide. Dive in to see how your region compares and where opportunities for improvement lie.
Get the infographics for FREE
Fill out the form to sign up for the Q3 2025 Guest Experience Benchmark Infographics and stay updated on the latest trends in guest experience.

Get the infographics for FREE
Sign up now to get the Q3 2025 Guest Experience Benchmark Infographics and stay updated on the latest trends in guest experience.