







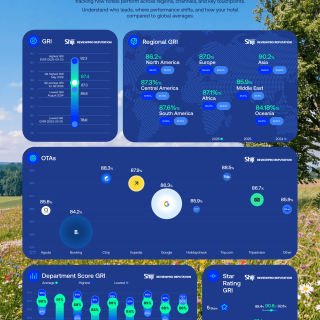




Every review tells a story. In the Q3 2025 Guest Experience Benchmark Infographics, we uncover the latest shifts in guest satisfaction and online reputation worldwide. From rising global review volume to regional contrasts, the data reveals how hospitality is evolving.


Every review tells a story. In the Q3 2025 Guest Experience Benchmark Infographics, we uncover the latest shifts in guest satisfaction and online reputation worldwide. From rising global review volume to regional contrasts, the data reveals how hospitality is evolving.


Our most change-rich edition yet: Q3 brought big shifts, and we captured them all.
This edition introduces key updates designed to ensure even greater accuracy and regional relevance:
– Hotels.com data now merged into Expedia Group for a clearer source structure
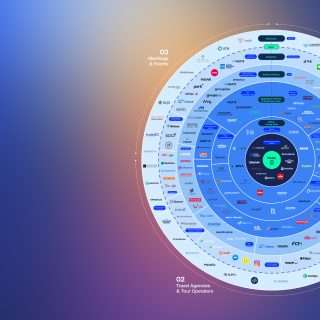
– Region-specific insights expanded with new sources like eLong, Otelpuan, CHECK24, and Yelp
– New dimensions, including guest types, reveal deeper satisfaction trends across regions
Some more key results

Our most change-rich edition yet: Q3 brought big shifts, and we captured them all.
This edition introduces key updates designed to ensure even greater accuracy and regional relevance:
– Hotels.com data now merged into Expedia Group for a clearer source structure
– Region-specific insights expanded with new sources like eLong, Otelpuan, CHECK24, and Yelp
– New dimensions, including guest types, reveal deeper satisfaction trends across regions
Get the infographics for FREE
Fill out the form to download the Q3 2025 Guest Experience Benchmark Infographics and stay updated on the latest trends in guest experience.

Get the infographics for FREE
Download now to get the Q3 2025 Guest Experience Benchmark Infographics and stay updated on the latest trends in guest experience.