









Report + Infographic
Q3 2026Global Guest Experience Benchmark Report
What 11.9 million hotel reviews and 45.7 million guest mentions reveal about reputation, response performance, guest loyalty, and the factors driving hotel success in 2026.

Download the Q3 Infographic and Report

Insights
What You’ll
Learn
The Q3 2026 report answers some of the most important questions facing hotel operators today.
- Is guest satisfaction going up or down?
- Which hotel regions are improving the most?
- What review sites are guests using?
- How strong are review volumes?
- Which areas of the guest experience are improving?
- What can operators learn from the global picture?
Real Results
Q3 2026 at a Glance
Guest satisfaction across the review dataset.
How frequently hotels respond to guest reviews.
Average time between review and hotel response.
Quarter-on-quarter movement.
Insights
5 Key Findings
from Q3 2026
The Reputation Gap Between Luxury and Midscale Hotels Is Narrowing
Four-star and three-star properties continue to improve their guest satisfaction scores faster than luxury hotels.
While five-star hotels remain the highest rated segment, lower-tier properties are steadily closing the gap, suggesting that delivering strong value may be becoming just as important as delivering premium experiences.
Guests increasingly evaluate value alongside luxury, creating opportunities for hotels outside the premium segment to strengthen their market position.
Review Conversations Are Moving Beyond Google and Booking
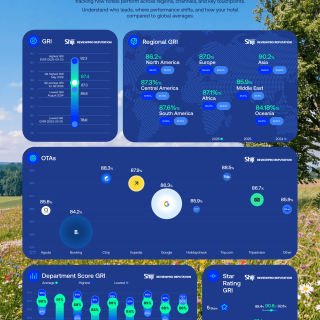
Review volume remains concentrated on Booking and Google, but platforms such as Ctrip continue gaining influence.
Hotels that focus only on Google and Booking risk missing an increasing share of guest feedback.
Reputation management strategies need broader channel coverage than ever before.
Review Response Times Have Improved Dramatically
Across all star categories, average response times fell to approximately three days in Q3 2026.
Hotels are becoming faster at acknowledging guest feedback, creating more opportunities to influence future travellers and recover negative experiences.
Fast responses strengthen guest trust and improve reputation visibility across review platforms.
Room Experience Remains the Biggest Reputation Risk
Across multiple regions and segments, room-related complaints continue to be among the largest negative contributors to overall guest satisfaction.
While service, staff, and positive experiences often drive strong reviews, recurring room issues continue to have an outsized impact.
Operational improvements in room quality often generate larger reputation gains than introducing new amenities.
Guest Loyalty Doesn’t Always Follow Reputation
Global NPS improved, but not every segment experienced the same trend. Luxury hotels increased advocacy while some lower-tier categories showed weaker results.
A strong reputation score alone does not automatically translate into guest recommendations.
Hotels need to monitor reputation and loyalty metrics together.

Regions
Global Performance Snapshot
See every region in detail
Guest reviews influence booking decisions, pricing power, brand perception, and operational performance. Understanding how guest expectations are changing allows hotels to make more informed decisions.
The Q3 2026 benchmark provides the industry context needed to make better decisions.
Guide Contents
Get the Full Q3 2026 Benchmark Report
- Global, regional and key-market analysis
- Reputation and sentiment trends
- Review source performance
- GRI and response-rate benchmarks
- Guest-experience insights
- Actionable recommendations

Download Infographic + Full Report
Get the Q3 2026 infographic and full benchmark report in a convenient PDF format.
