









Q2 2024 Guest Experience
Benchmark Infographics
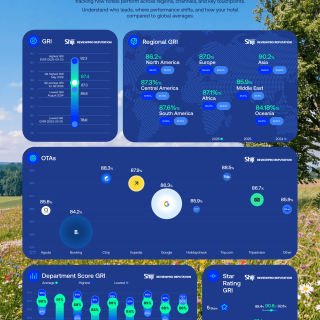
The Q2 2024 Guest Experience Benchmark Infographics
is here! For this quarter we included NEW DATA:
the review volume evolution over the last 3 years and
the average time of response to reviews by star category.
And we want to make sure you get these exclusive insights
as soon as we release them.


Q2 2024 Guest
Experience Benchmark Infographics
The Q2 2024 Guest Experience Benchmark Infographic is here! For this quarter we included NEW DATA: the review volume evolution over the last 3 years and the average time of response to reviews by star category. And we want to make sure you get these exclusive insights
as soon as we release them.
Here’s what’s coming your way:
✓ Fresh Global and Regional Data
✓ GRI Evolution Over the Years
✓ Star Rating Review Response
✓ Department Performance Scores
✓ Top Factors Affecting GRI


Here’s what’s coming your way:
- Fresh Global and Regional Data
- GRI Evolution Over the Years
- Star Rating Review Response
- Department Performance Scores
- Top Factors Affecting GRI